Speed test · Workspace · FAQ
User guide
Speed & Uptime Watch tests how fast your web pages load, watches your websites, APIs, servers, certificates and scheduled jobs around the clock, tells the right people when something breaks, and shows your customers a status page.
- Getting started
- Speed tests
- The 14 performance checks
- Monitors
- How outages are confirmed
- Alert channels
- Escalation policies
- Incidents
- Maintenance windows
- Status pages
- SLA reports
- Probes
- Users and roles
- REST API
- Settings and branding
- Keyboard shortcuts and accessibility
1. Getting started
Sign in with your e-mail address. The dashboard shows every monitor with its status, the last 24 hours of response times, uptime and open incidents. It refreshes itself every 15 seconds.
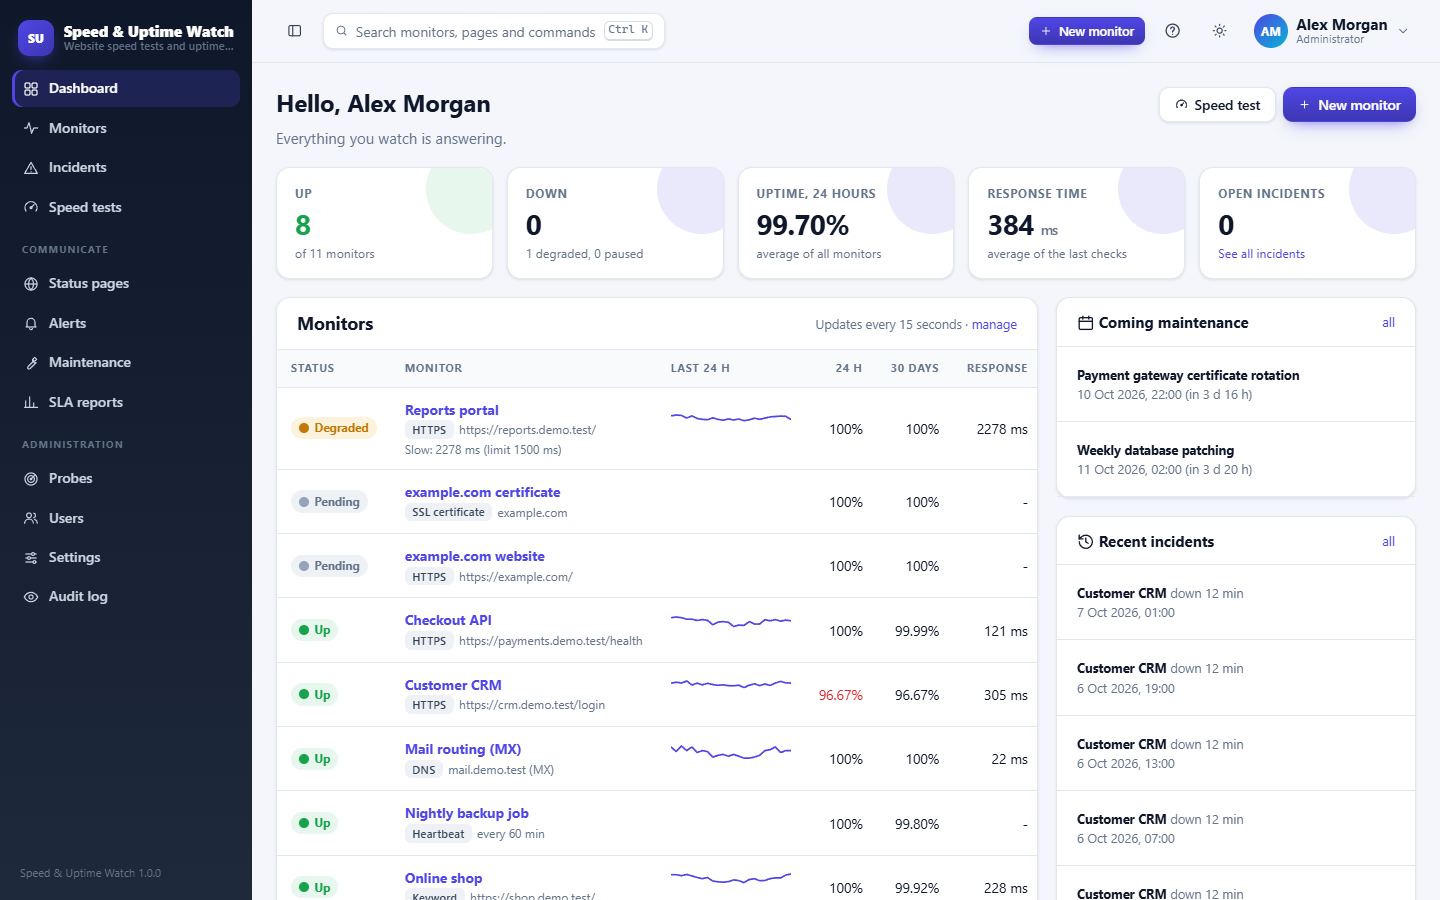
Three steps to a working setup:
- Add a monitor (Monitors - New monitor). Pick what to check; the example buttons fill in a working setup.
- Add an alert channel (Alerts - Channels), for example your LINE group or Slack channel, and press Send test.
- Publish a status page (Status pages - New) and choose which monitors your customers see.
2. Speed tests
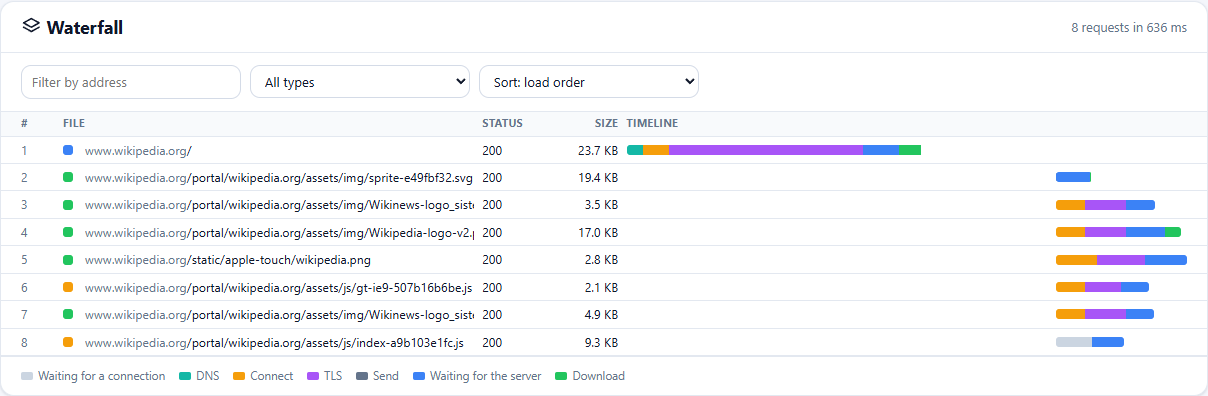
Enter an address on the home page (no sign-in needed) or under Speed tests. The page is downloaded the way a browser does: first the HTML (following redirects), then every style sheet, script, image, font and frame it asks for - and the files the style sheets ask for - with up to six connections per site. Each request is timed in phases:
| Phase | Meaning |
|---|---|
| Waiting | All six connections to that site were busy. |
| DNS | Looking up the address of the server. |
| Connect | Opening the TCP connection. |
| TLS | The secure (https) handshake. |
| Waiting for the server | From sending the request to the first byte of the answer ("time to first byte"). |
| Download | Receiving the file. |
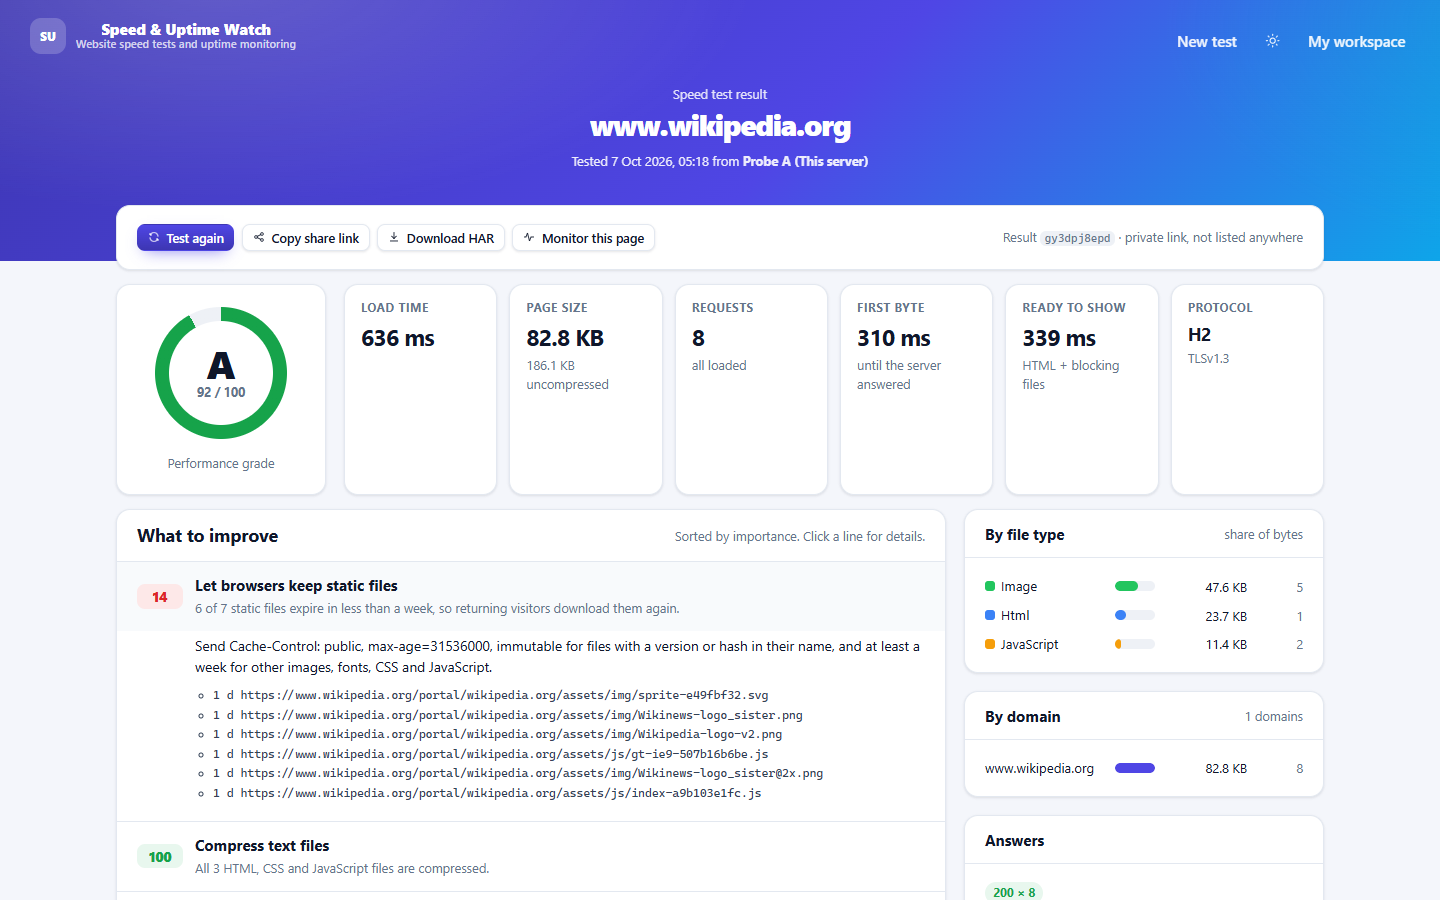
The waterfall lists every request in load order. Filter by address or file type, sort by time or size, and click a line for its headers, compression, caching and connection details. Download HAR exports everything in the HTTP Archive format that browser developer tools and other analysers import. Every result has a private link you can share.
The test never runs code from the tested site, so files a script would load later are not included. Only public addresses can be tested from the home page.
3. The 14 performance checks
Each check scores 0-100 and has a weight; the grade is the weighted average (A from 90, B from 80, C from 70, D from 60, E from 50).
| Check | What it looks at |
|---|---|
| Compress text files | HTML, CSS, JavaScript, JSON and SVG over 1 KB should be sent with Brotli or gzip. |
| Let browsers keep static files | Images, fonts, CSS and JavaScript should be cacheable for at least a week. |
| Keep the number of requests low | Up to 40 is excellent; above 180 hurts. |
| Keep the page light | Up to 1 MB is excellent; above 6 MB hurts. |
| Avoid redirects | Each redirect costs a full round trip. |
| Answer quickly | The server should start answering within 200 ms. |
| Show the page sooner | Scripts in <head> without defer/async, and many style sheets, delay the first paint. |
| Use modern image formats | Large JPEG, PNG and GIF images could be WebP or AVIF. |
| Avoid very large images | Images over 300 KB. |
| Minify CSS and JavaScript | Files with comments, indentation and many short lines. |
| Fix broken requests | Answers of 400 and above, and failed downloads. |
| Serve everything over HTTPS | HTTPS, Strict-Transport-Security, and no files over plain HTTP. |
| Use HTTP/2 or HTTP/3 | Whether the server offers a modern protocol. |
| Limit third-party domains | Every extra domain needs its own look-up, connection and handshake. |
4. Monitors
| Type | Checks | Good for |
|---|---|---|
| Website or API | HTTP(S) status code (default 200-399), response time, optional keyword that must or must not appear, custom method, headers and body | Web sites, shops, health endpoints, APIs |
| TCP port | The port accepts a connection | Databases, mail servers, SSH, game servers |
| Ping | The host answers ICMP echo | Routers, VPN gateways, servers |
| DNS record | A, AAAA, CNAME, MX, NS or TXT exists and contains the expected value; optional name server | Mail routing, domain hijacking, migrations |
| SSL certificate | Trusted, matches the name, not expired; warns N days before expiry | Every HTTPS site |
| Heartbeat | Your job calls a secret address; if it does not arrive in time, it is an outage | Backups, cron jobs, ETL, invoices |
Checks can run every 30 seconds. A monitor is Up, Degraded (answers, but slower than your "slow above" limit, or a certificate expiring soon), Down, Pending (first check not done) or Paused.
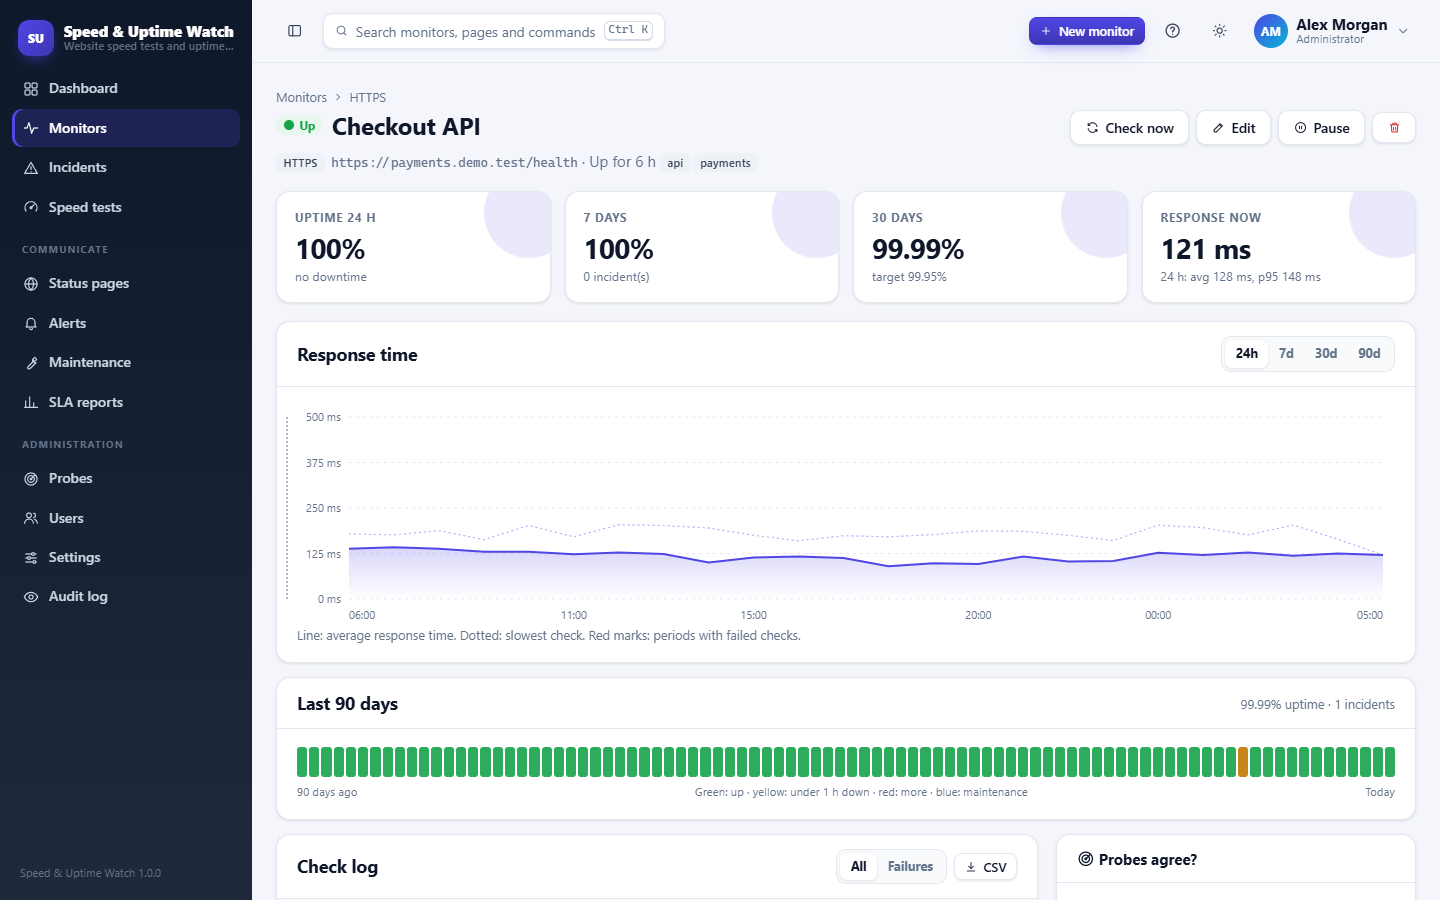
The monitor page shows uptime for 24 hours, 7, 30 and 90 days, a response-time chart (move the mouse or use the arrow keys for details), the 90-day bar, the latest result of every probe and the check log (export as CSV). Check now runs a check immediately.
Heartbeat monitors show a secret address after saving. Add one line at the end of your job, for example
curl -fsS -m 10 https://your-server/api/v1/heartbeat/<token> (or Invoke-WebRequest on Windows). You can add
?msg=text; it appears in the check log.
5. How outages are confirmed
One failed check does not wake anybody up. When a probe sees a failure, the monitor becomes "suspect" and the other probes check it again a few seconds later. Only when the required number of different probes agree (2 by default) is the monitor declared down, an incident opened and the alerts sent. If any probe gets a good answer, the suspicion is dropped. With fewer probes online than required, the same probes re-check instead. The incident starts at the first failed check, so downtime is measured accurately.
6. Alert channels
| Channel | How to set it up |
|---|---|
| Enter one or more addresses. The server needs MAIL_HOST (see README). | |
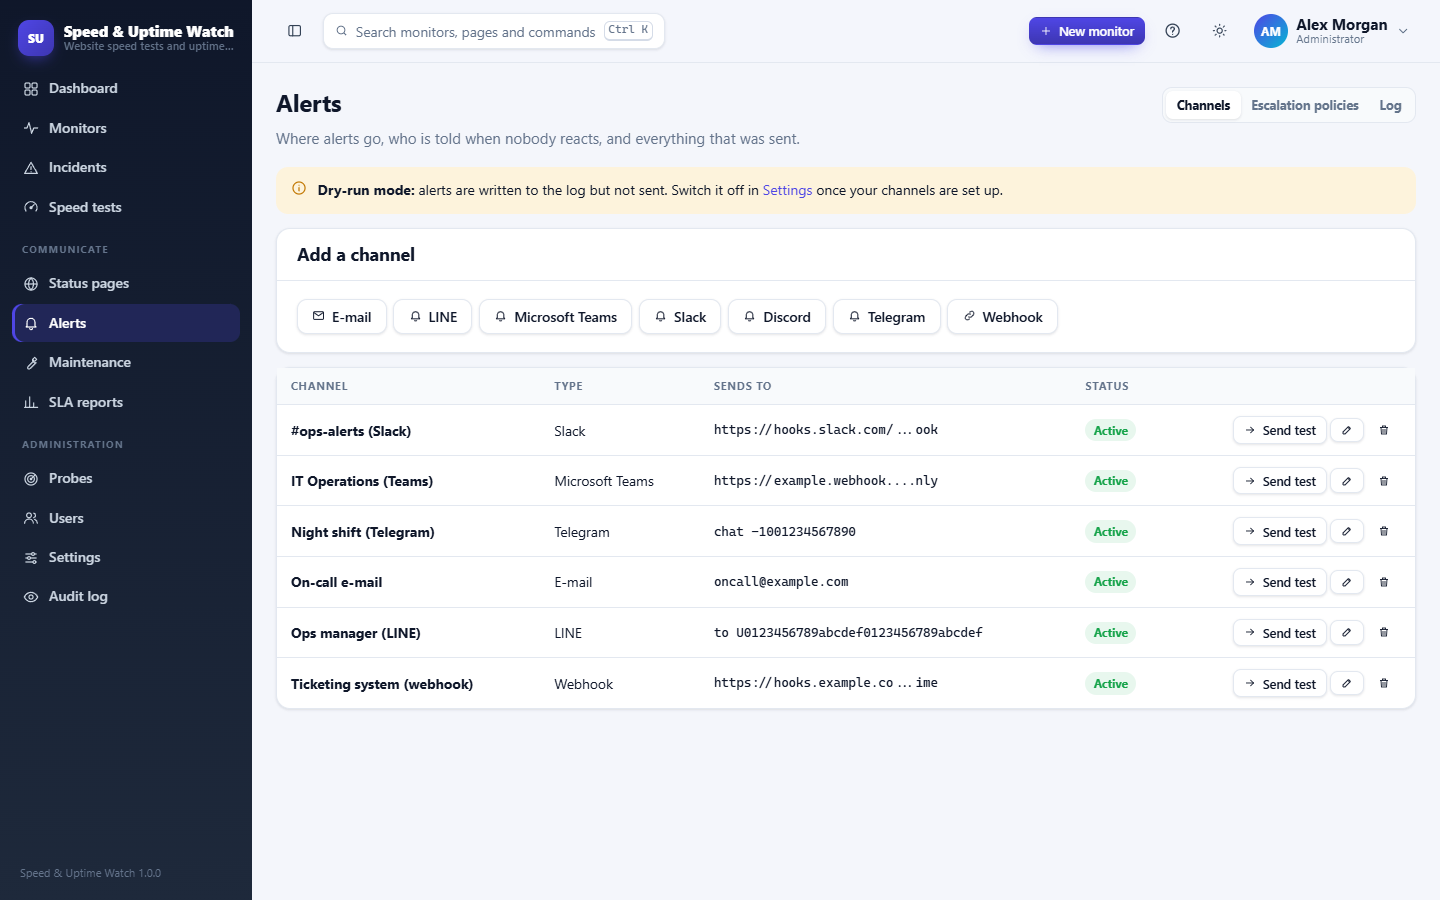
| LINE | Create a Messaging API channel in the LINE Developers console, copy the long-lived channel access token, and enter your user ID (on the channel's Basic settings page) or a group ID after adding the bot to a group. |
| Microsoft Teams | In the channel: Workflows - "Send webhook alerts to a channel". Copy the URL. |
| Slack | Apps - Incoming Webhooks - "Add New Webhook to Workspace". Copy the URL. |
| Discord | Channel settings - Integrations - Webhooks - New Webhook - Copy Webhook URL. |
| Telegram | Create a bot with @BotFather, add it to your group, enter the bot token and the chat ID. |
| Webhook | Any URL receives a JSON POST (event, subject, message, incidentId, monitorId, sentAt). With a signing secret, each
request has X-Signature-256: sha256=<HMAC-SHA256 of the body>. |
Tokens and webhook addresses are stored encrypted and never shown again; leave the field empty when editing to keep them. Use Send test after saving. The Log tab shows every alert, its status and the error if sending failed (failed sends are retried after 1, 2, 5, 15 and 30 minutes).
7. Escalation policies
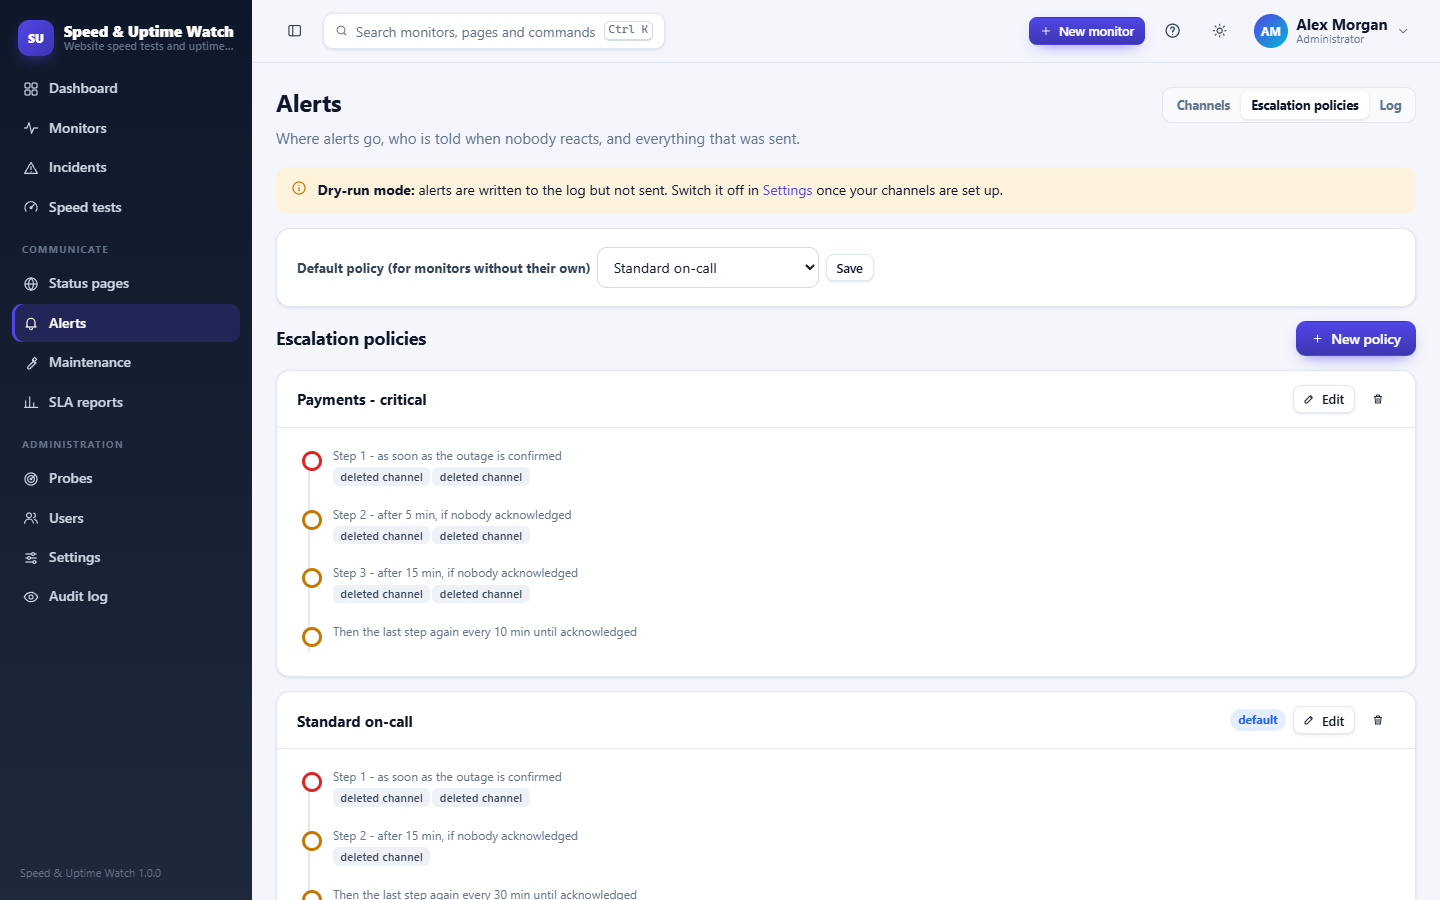
A policy has up to six steps. Step 1 goes out as soon as an outage is confirmed; each later step goes out after its number of minutes only if nobody has acknowledged the incident. Optionally the last step repeats every N minutes. Choose a policy per monitor, or set a default policy. Without any policy, every active channel is alerted once. Recovery messages go to everybody who was alerted.
8. Incidents
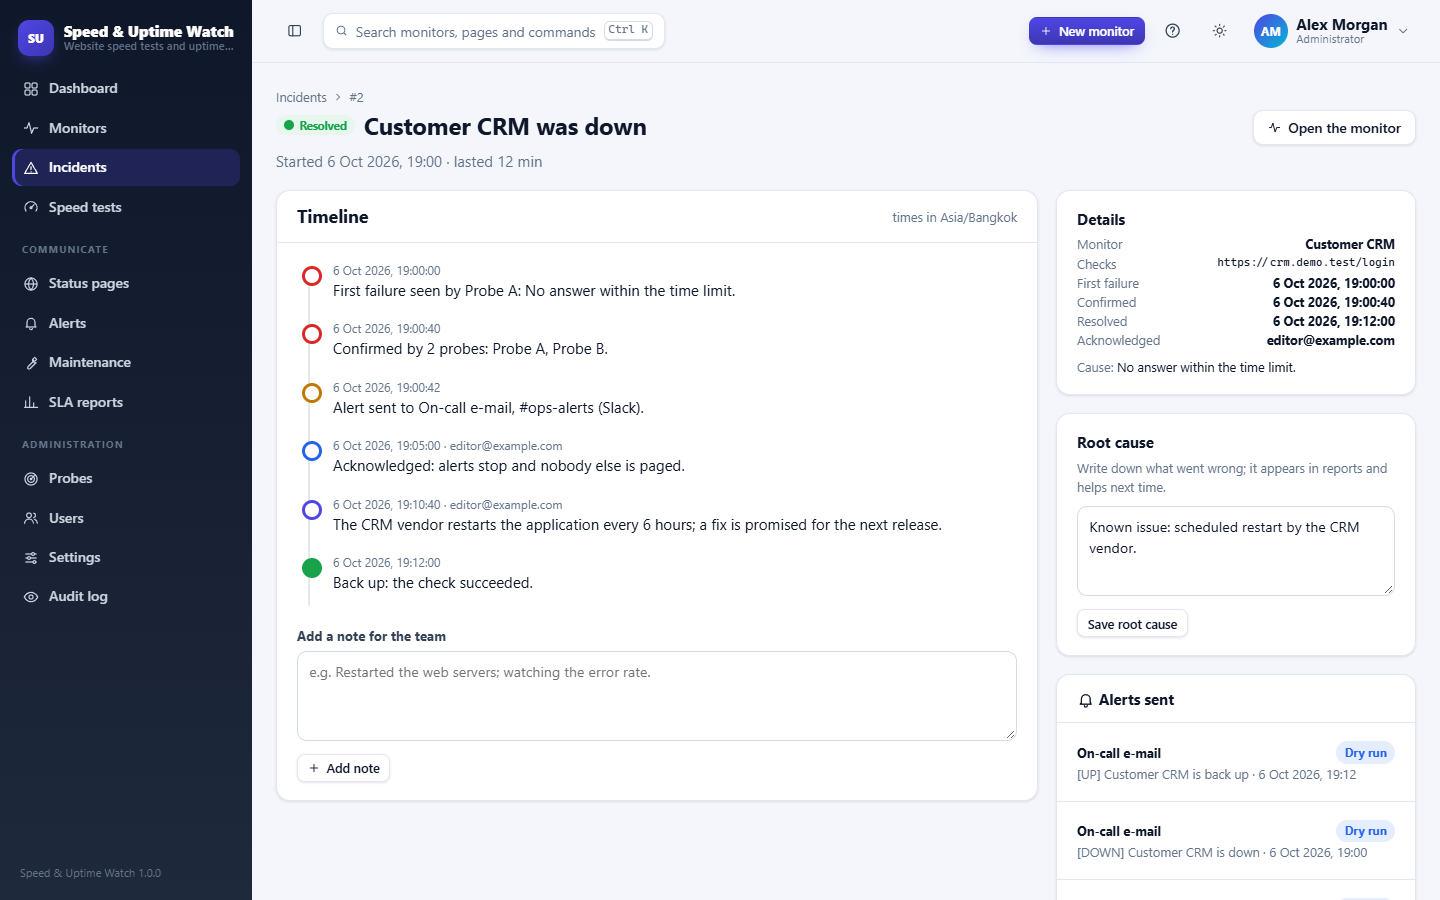
Each confirmed outage is an incident with a timeline: detected, confirmed (by which probes), alerts sent, acknowledged, notes and resolved. Acknowledge tells the team you are on it and stops escalation; the people already alerted are told who acknowledged. Add notes while you work, and record the root cause afterwards.
9. Maintenance windows
Plan one-time windows (from - to) or weekly ones (days, start time, duration) for some or all monitors. During a window checks continue and are logged, but nobody is alerted and the time is left out of the SLA. If a monitor is still down when the window ends, the alert goes out then. To tell your visitors, add a "Planned maintenance" post on the status page as well.
10. Status pages
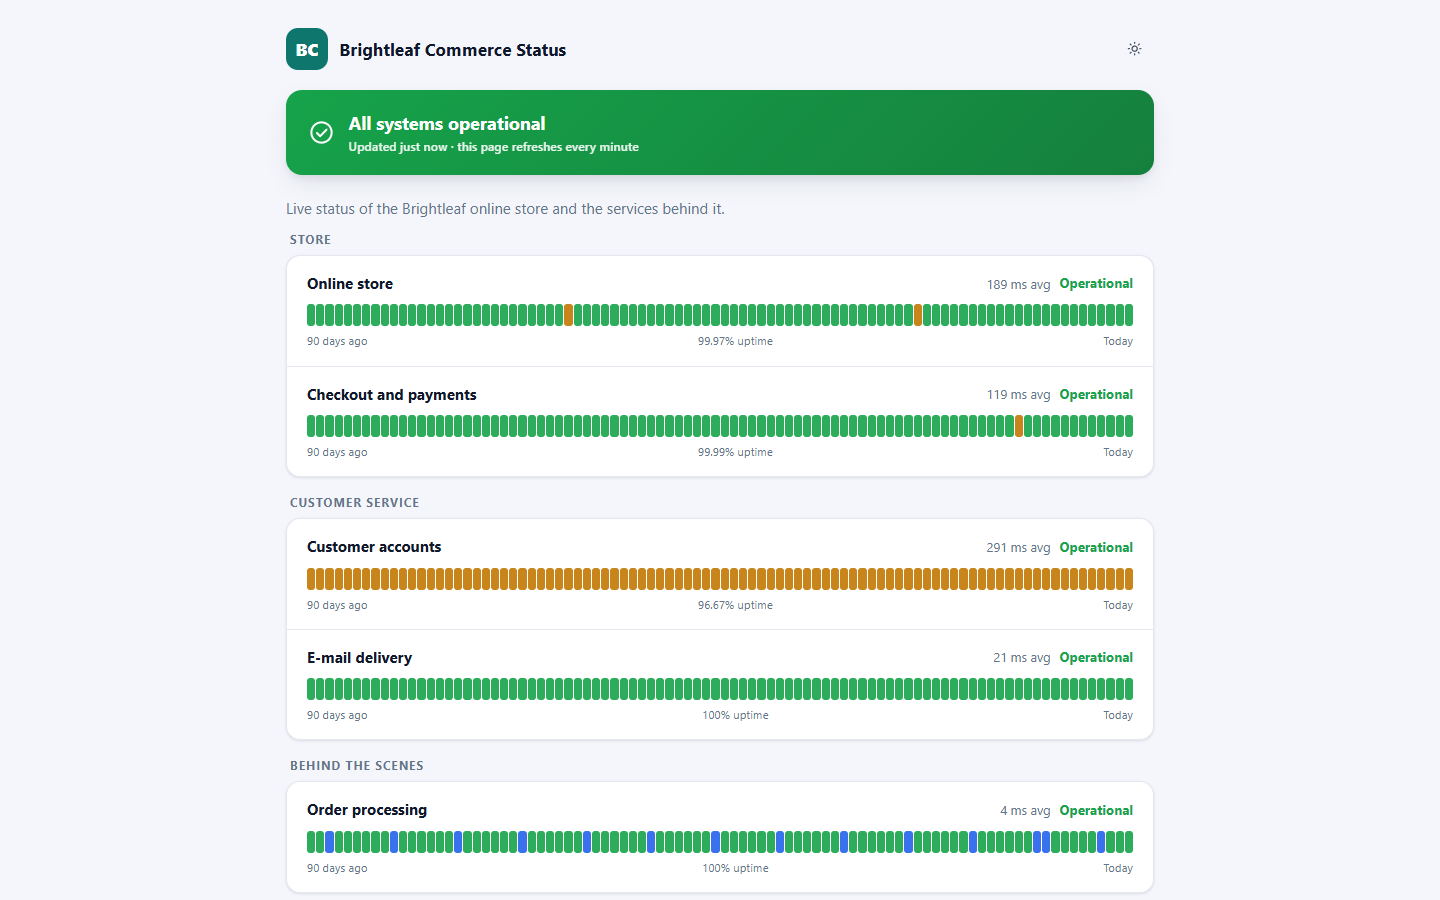
Create as many public pages as you need (for example one for customers and one for staff). Each has its own address
(/status/your-name), title, logo letters or image, color and footer, and shows the monitors you choose under friendly names and
groups, with 90 days of history. Posts tell visitors about incidents (investigating - identified - monitoring - resolved) and planned
maintenance; each post can get updates.
Custom domain: enter e.g. status.example.com in the page settings and point a DNS CNAME record of that name at this server
(and add the name to your reverse proxy / certificate). Visitors who open it see the status page directly.
Also available: /status/your-name/summary.json for scripts and /badge/your-name.svg, a small status badge for
README files and intranets.
11. SLA reports
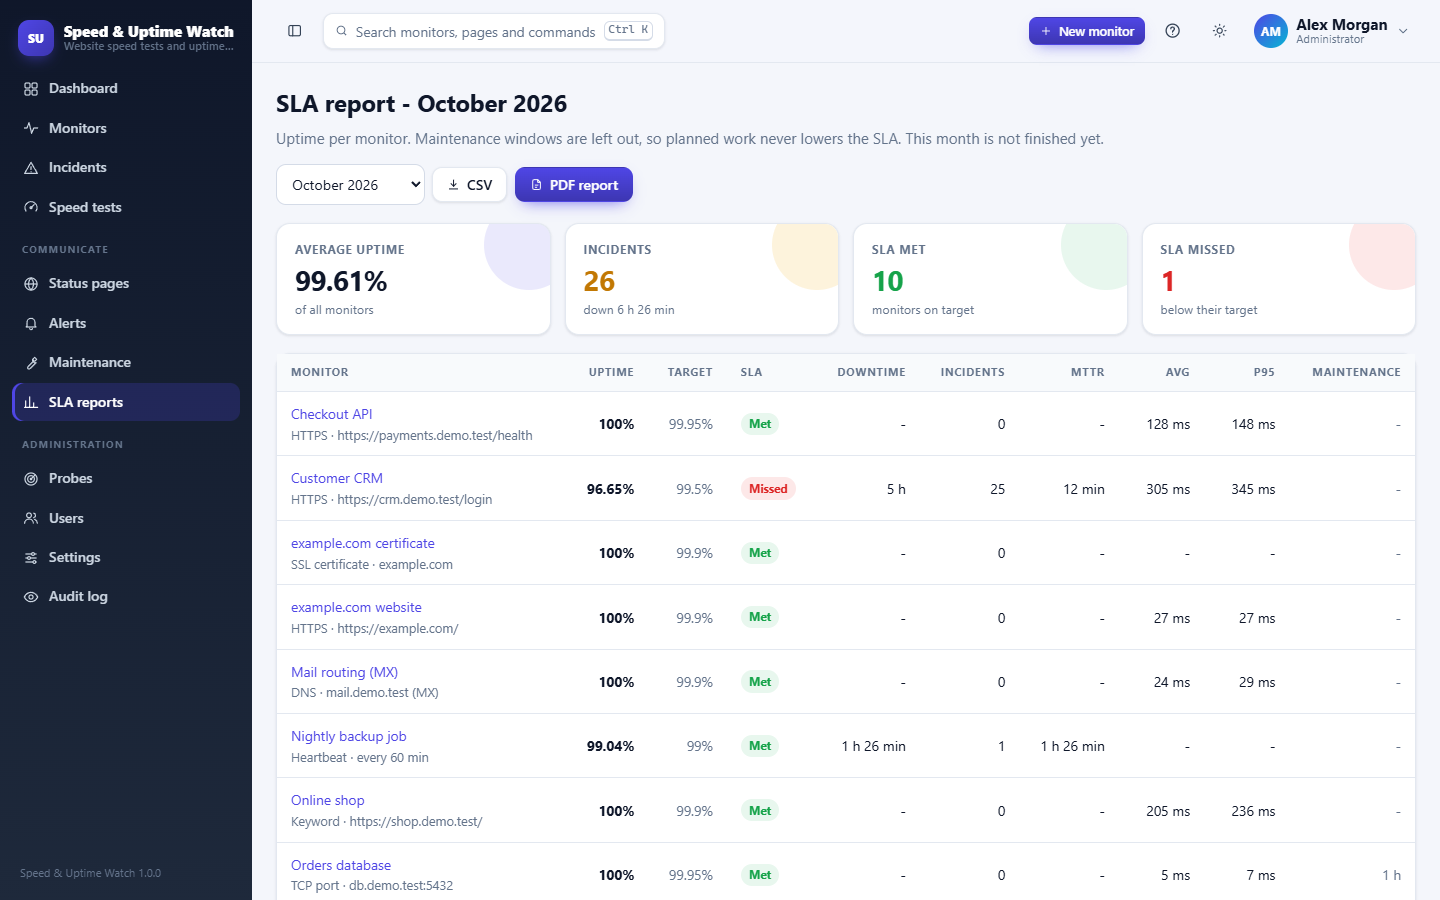
Choose a month to see, for every monitor: uptime, SLA target and whether it was met, downtime, number of incidents, mean time to recovery, average and 95th-percentile response time and maintenance time. Download it as PDF for management or customers, or as CSV. Maintenance time is excluded from both the downtime and the measured time.
12. Probes
Probes are the places checks run from. The application has two built-in probes. For real independence, add remote probes in other networks or regions: an administrator adds one on the Probes page (its token is shown once), then starts the same program on the other server:
java -Xmx96m -jar speed-uptime-watch-1.0.0.jar --app.mode=probe \
  --app.probe-agent.server-url=https://watch.example.com \
  --app.probe-agent.token=prb_...
A remote probe needs only Java 21 and outbound HTTPS to the main server. With --app.probe-agent.deadman-webhook=https://... it
posts to that webhook itself when it cannot reach the main server for 5 minutes (dead man's switch).
13. Users and roles
| Role | May |
|---|---|
| Viewer | See everything; cannot change anything. |
| Editor | Also create and change monitors, alert channels, policies, maintenance, status pages; acknowledge incidents. |
| Administrator | Also users, probes, settings and the audit log. |
New users get a temporary password and choose their own at first sign-in. After five wrong passwords an account is locked for 15 minutes; an administrator can unlock it with "Reset password". Every sign-in and change is in the audit log, which cannot be edited.
14. REST API
Create an API key under My account and send it as X-Api-Key: suw_... (or Authorization: Bearer suw_...).
The key acts with your role. Main endpoints (full description: /api/openapi.yaml):
| Call | What it does |
|---|---|
GET /api/v1/monitors | All monitors with state (filter ?state=DOWN, ?tag=web) |
POST /api/v1/monitors | Create a monitor, e.g. {"name":"Shop","type":"HTTP","target":"https://shop.example.com","intervalSec":60} |
PUT / DELETE /api/v1/monitors/{id} | Change or delete |
POST /api/v1/monitors/{id}/pause / resume | For deployments |
GET /api/v1/monitors/{id}/uptime?period=30d | Uptime, downtime, SLA met, response times and a series |
GET /api/v1/incidents?filter=open | Incidents; POST /api/v1/incidents/{id}/acknowledge |
POST /api/v1/speedtests | Start a speed test ({"url":"https://..."}), then poll GET /api/v1/speedtests/{id} |
POST /api/v1/heartbeat/{token} | Heartbeat (no key needed; the token is the secret) |
15. Settings and branding
Administrators can switch alert dry-run (alerts are logged, not sent), allow private addresses for intranet monitoring, turn the
public speed test on or off and set how many probes must agree. Name, logo, colors and footer come from brand.properties
next to the program (see README) and apply to every page, e-mail, status page and PDF.
16. Keyboard shortcuts and accessibility
| Keys | Action |
|---|---|
| Ctrl + K (or /) | Search monitors and run commands |
| G then D / M / I / S / R | Dashboard / Monitors / Incidents / Speed tests / Reports |
| N | New monitor |
| Ctrl + B | Show or hide the menu |
| ? | This guide |
The sun icon at the top offers light, dark, "same as my device" and a high-contrast theme, and four text sizes. Everything works with the keyboard; charts can be explored with the arrow keys.
Speed & Uptime Watch 1.0.0